Dashboard status
Overview
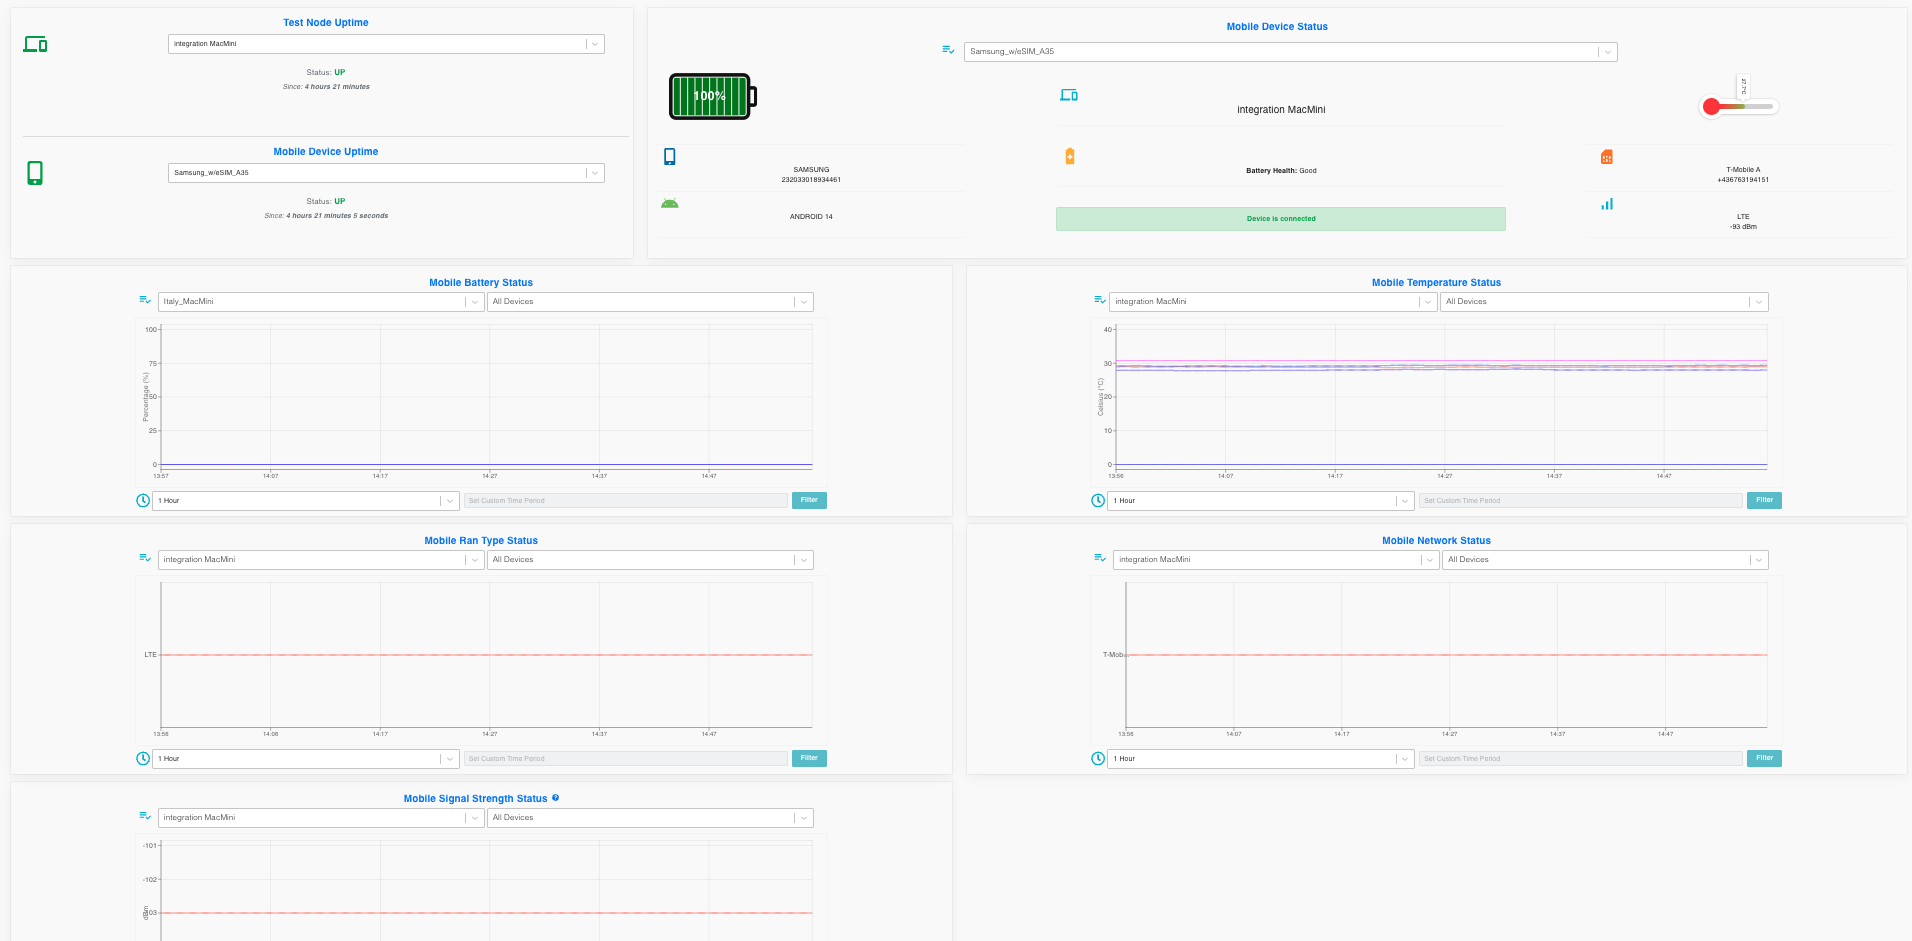
The status page displays the Test Node Uptime and Mobile Device Uptime tables: how long each test node and each mobile device has been up or down.
Below them, the Mobile Device Status card shows the details of one device, and five charts show the Mobile Battery Status, Mobile Temperature Status, Mobile Ran Type Status, Mobile Network Status and Mobile Signal Strength Status of the devices on a test node. Each chart has its own test node, device and time range selection.
Uptime tables
The Test Node Uptime and Mobile Device Uptime tables list every test node and every mobile device with its STATUS and NAME, for example "Up · 23h 47m". Hover over a row to see "Up for …", "Down for …" or "No events reported". Coloured dots above each table count the items per state.
Rows that are down come first. Items that are unknown or have been down for more than 24 hours are hidden; click Show N inactive (unknown / down 24h+) to list them and Hide inactive to hide them again. Each table has its own Refresh icon.

Mobile Battery Status
A line chart of the battery level of the devices on the selected test node.
The chart has its own Select Test Node list (the first node is selected at first) and, when there is data, a Filter Mobile Id list (default All Devices). The time range list below the chart offers 1 Hour (default), 6 Hours, 24 Hours and Custom; Custom shows a Custom Time Period picker and a Filter button. Times are shown in CET. When the node has no data, the chart reads "There is no data for selected Test Node."

Mobile Temperature Status
A line chart of the temperature of the devices on the selected test node.
The chart has its own Select Test Node list (the first node is selected at first) and, when there is data, a Filter Mobile Id list (default All Devices). The time range list below the chart offers 1 Hour (default), 6 Hours, 24 Hours and Custom; Custom shows a Custom Time Period picker and a Filter button. Times are shown in CET. When the node has no data, the chart reads "There is no data for selected Test Node."

Mobile Device Status
Choose a device in Select Device... to see its details: brand, operating system and the test node it is connected to; a battery gauge with the charging state and Battery Health; the temperature; whether the device is connected ("Device is connected" or "Device is not connected!"); the operator with the MSISDN; the IMSI; and the current RAN type with the signal strength (RSSI, dBm).

Mobile RAN Type Status
A chart titled Mobile Ran Type Status with the radio access technology of the devices on the selected test node over time.
The chart has its own Select Test Node list (the first node is selected at first) and, when there is data, a Filter Mobile Id list (default All Devices). The time range list below the chart offers 1 Hour (default), 6 Hours, 24 Hours and Custom; Custom shows a Custom Time Period picker and a Filter button. Times are shown in CET. When the node has no data, the chart reads "There is no data for selected Test Node."

Mobile Network Status
A chart of the network the devices on the selected test node were registered to over time.
The chart has its own Select Test Node list (the first node is selected at first) and, when there is data, a Filter Mobile Id list (default All Devices). The time range list below the chart offers 1 Hour (default), 6 Hours, 24 Hours and Custom; Custom shows a Custom Time Period picker and a Filter button. Times are shown in CET. When the node has no data, the chart reads "There is no data for selected Test Node."

Mobile Signal Strength Status
A line chart of the signal strength of the devices on the selected test node, plotted as RSSI (dBm). The tooltip also shows the RAN type and the operator. Click ? for an explanation of the values.
The chart has its own Select Test Node list (the first node is selected at first) and, when there is data, a Filter Mobile Id list (default All Devices). The time range list below the chart offers 1 Hour (default), 6 Hours, 24 Hours and Custom; Custom shows a Custom Time Period picker and a Filter button. Times are shown in CET. When the node has no data, the chart reads "There is no data for selected Test Node."
