Use trace filters
Adding Trace Filter to a Test Case
Below are the steps to add a trace filter to a Test Case.
-
Create a Test Case with the test steps from the Test Case tab of the TEO UI.
-
In the Enable Tracing section of the test case, click Enable Tracing.
-
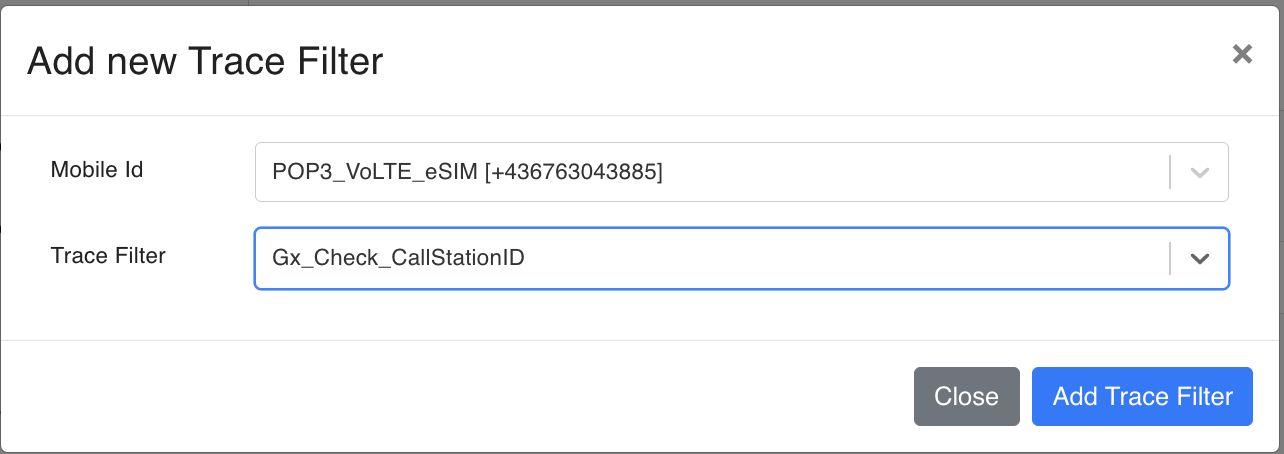
Select the Mobile Id and the Trace Filter created before, and click Add Tracing.
-
Save the Test Case.
-
Below are the example screenshots.
Preparing PDML file
In order to prepare a PDML file, we need a pcap file that contains the necessary network packets belonging to the protocol we want to filter.
Let’s say we want to trace SIP protocol packets. We can directly export the pcap file into the PDML file via Wireshark. However, the PDML file might be huge in size if we export it directly. So it is better to filter it by protocol first to have a smaller size PDML file. To create a PDML file that contains all the SIP protocol packets, first, we should filter the pcap file with the “sip“ keyword, then export the filtered pcap file and open it and finally export that final pcap file as a PDML file and save it.
Below are the step-by-step screenshots.


Procedure
Below steps should be followed to do Trace Verification. Every call needs an access token (see Getting an access token) with the Standard or Admin role.
- Run the Test Case that the Trace Filter has been added to.
- During the test case execution, the TEO backend will register a trace session for this test case execution, which can be retrieved via an API call as below:
curl --request GET \
  --url "$BASE_URL/api/custom/tracesessions" \
  --header "Authorization: Bearer $TOKEN"
BASE_URL is your API address, https://app-<environment>.quadified.com.
- The API call above returns a JSON array. It will contain all active trace sessions. If there are multiple running test cases with trace enabled, then there should be a separate trace session per the IMSI involved in each filter in the running test cases.
[
  {
    "id": "01967210-da62-4b24-a48b-6595687f3df4",
    "imsi": "234150000000001",
    "msisdn": "+447700900123",
    "callbackUri": "https://<environment>.quadified.com/api/custom/trace/01967210-da62-4b24-a48b-6595687f3df4"
  }
]
- Now, as a last step, we should upload the PDML file created before.
- Once there is an active session, the Trace Server will be posting (HTTP POST) trace packets (as PDML files) to the given
callbackUri. - The below step is just a simulation of this process: send the PDML file as
multipart/form-datawith the field namefileto the session's upload address.
- Once there is an active session, the Trace Server will be posting (HTTP POST) trace packets (as PDML files) to the given
curl --request POST \
  --url "$BASE_URL/api/custom/trace/<session id>" \
  --header "Authorization: Bearer $TOKEN" \
  --form "file=@VoLTE_REG_sip_test.pdml"
If all goes well, the response for the upload should be like below:
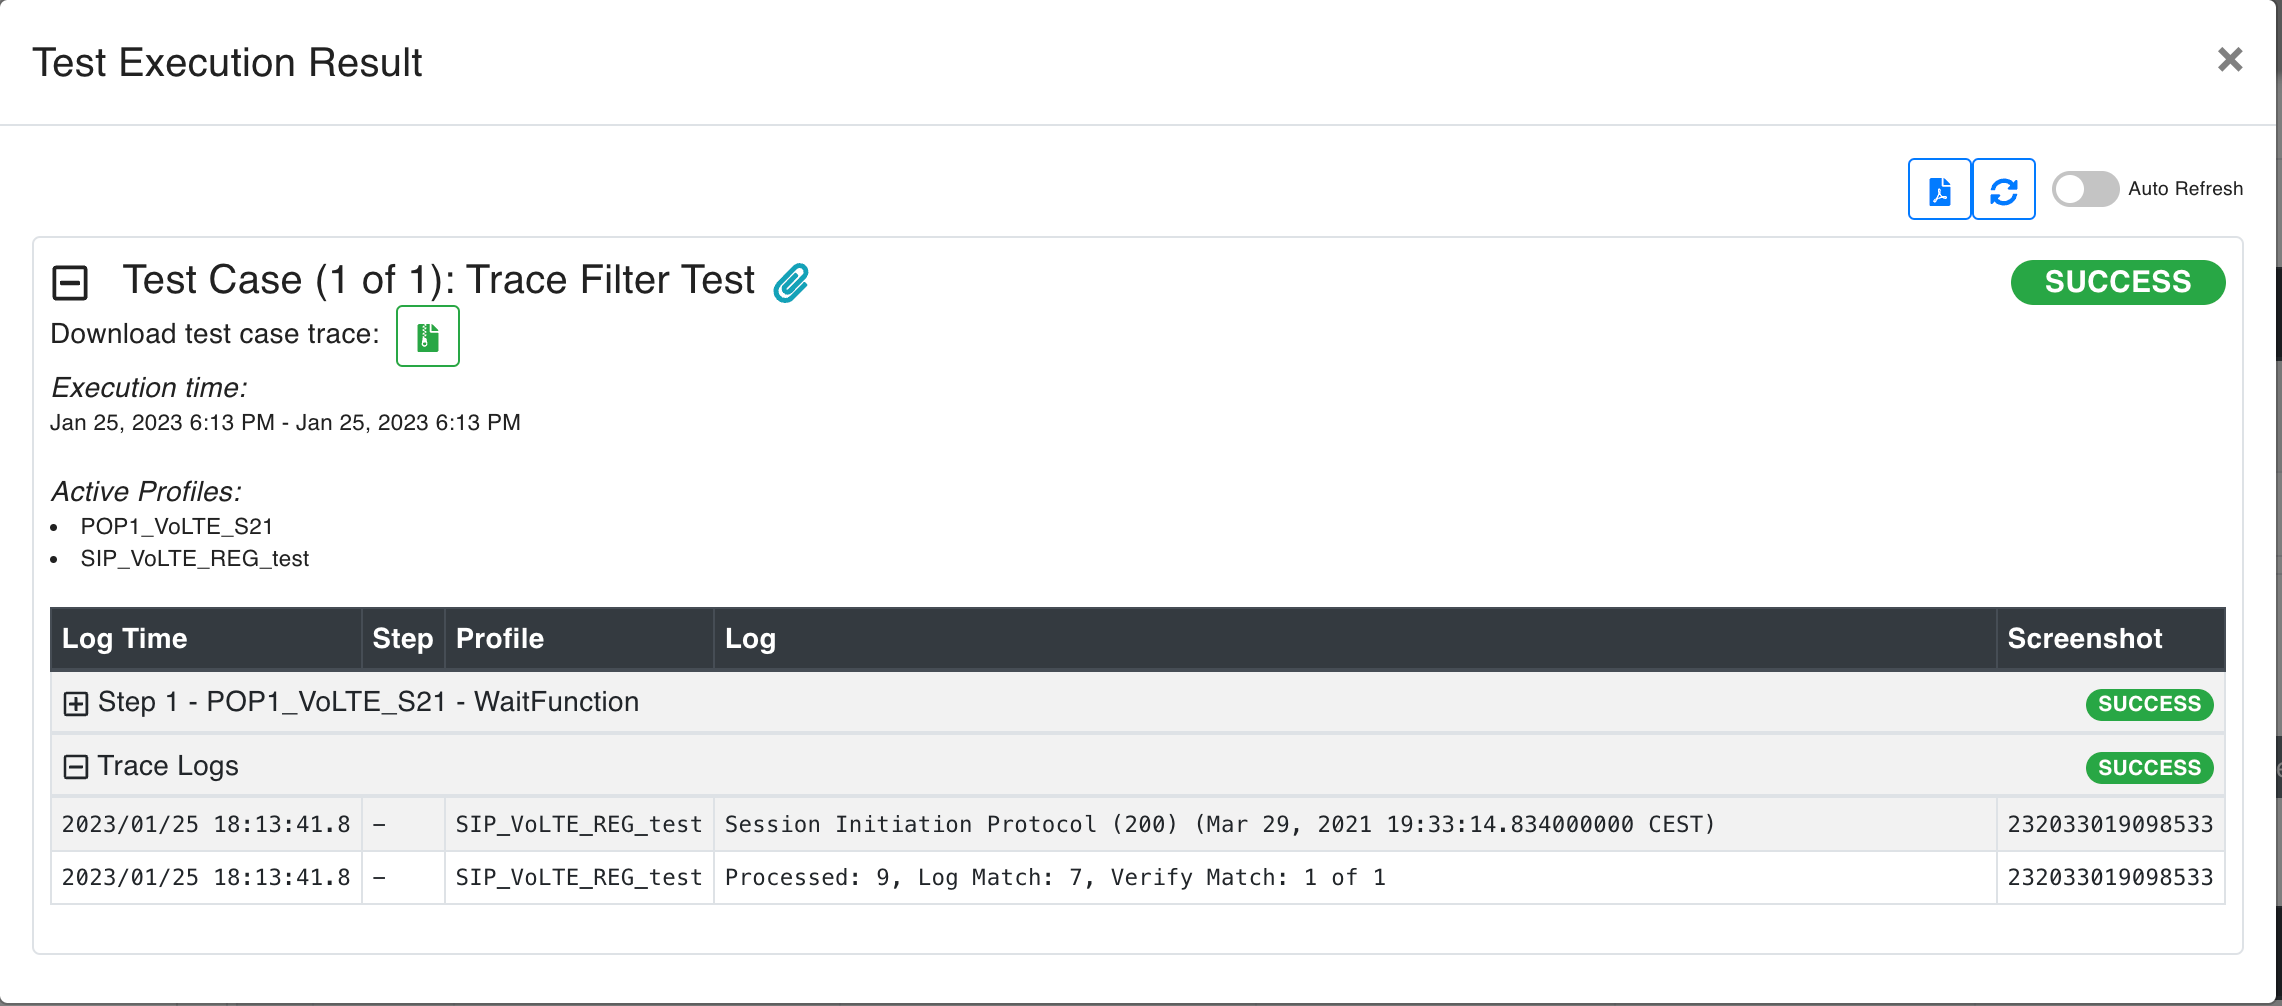
After the test execution is finished, the matched logs can be checked from the Test Case Execution Result page. Also, the trace logs can be downloaded from this page. Below is an example screenshot:
NOTE: Note that the session will be active while the Test Case is running, and will be removed afterwards. Hence the upload needs to happen while it is running.