Dashboard summary
Overview
This page provides an overview of the test process status in the QuadTEO interface and contains the following sections:
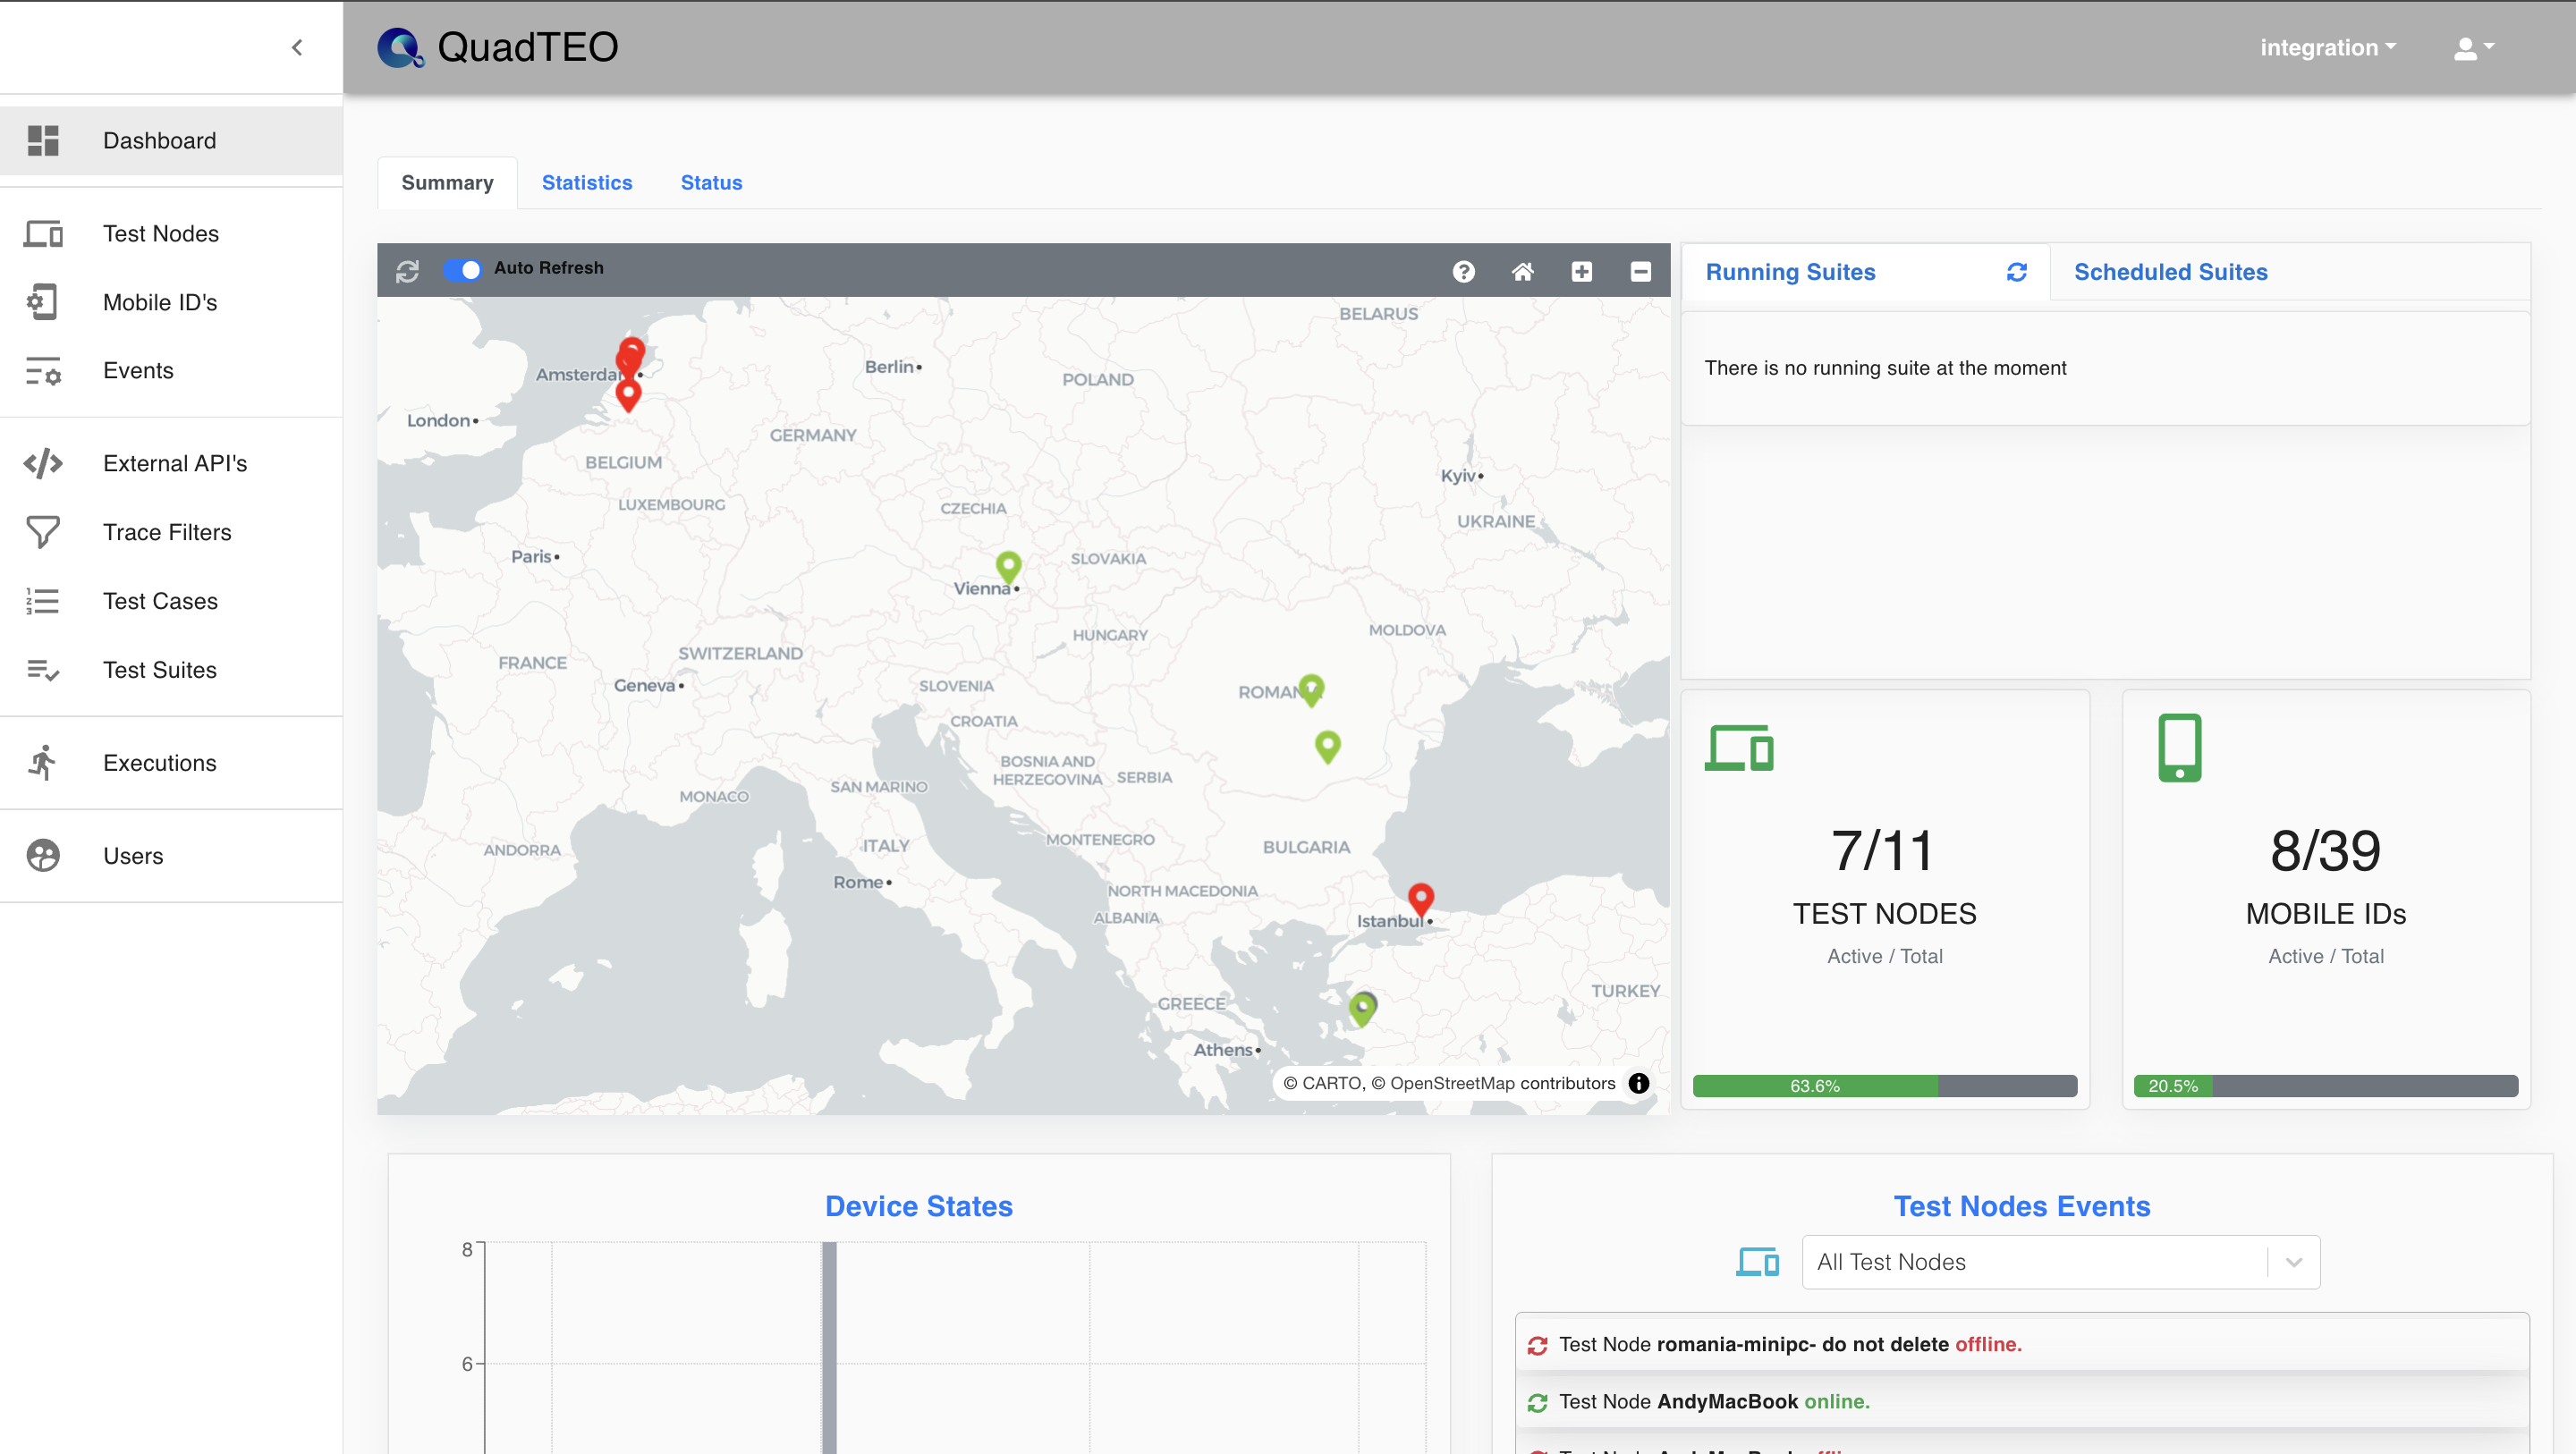
Map

The locations and statuses of the test nodes connected to the TEO are displayed on the world map.

Number of phones connected to the Test Node and their status are shown.
The pin colour comes from the node's last heartbeat:
- Green: online (heard from within the last 72 seconds).
- Yellow: unknown (last heard 72-120 seconds ago).
- Red: offline.
A split pin means that nodes with different states share one location; a grey pin groups several nodes. Hover over a pin to see the node's status, when it was last seen online, its city and country, and its Mobile IDs by state (Available, Busy, Unavailable, Failed).
The map toolbar has a refresh button, an Auto Refresh switch (on by default, every 60 seconds) and home / zoom buttons. Click ? to open the Map Legend.
Running and Scheduled
This panel has two tabs, Running and Scheduled. From here you can quickly check the progress of running suites and access their logs.
- Running: each running suite shows a progress bar and a Show Logs button. A Re-run badge marks a re-run of failed test cases; a Direct Run badge marks a single test case run without a suite. When nothing is running, the tab reads "There is no running task at the moment".
- Scheduled: each suite shows its next run time. When nothing is scheduled, the tab reads "There are no scheduled suites at the moment".
- Every row has an icon that opens the suite in a new tab. The Refresh icon reloads the lists.

Scheduled Suites
Test suites scheduled for a future date and time are shown in the Scheduled tab.

Conflicts
When two scheduled suites may need the same device at the same time, a ⚠ Conflicts (N) tab appears as the first tab of the panel and is selected automatically. Each row names a suite with a possible conflict and has an icon to open the suite in a new tab. See Schedule Conflict Detection.
Test Nodes
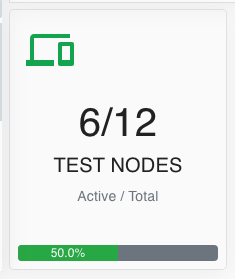
The TEST NODES card shows how many test nodes are active out of the total, with a percentage bar. Click the card to open the Test Nodes list.
Mobile IDs
The MOBILE IDs card shows how many Mobile IDs are active out of the total. A Mobile ID counts as active when it is Available or Busy on an online test node. Click the card to open the Mobile ID's list.

Device States
A column chart titled Device States shows, for each online test node, how many of its devices are available, busy, unavailable or failed. When no test node is online, it reads "There is no online Test Node!".

Test Nodes Events
The Test Nodes Events card lists recent events on the test nodes: connected, disconnected and rebooted devices, alerts, connectivity problems, device information updates and recovered failures. Heartbeats are not shown. Choose a node in the selector (default All Test Nodes); the list shows 20 events per page. The full list is on the Events page.
