Overview
The Statistics page gives you a consolidated view of how your Test Suites and Test Cases are performing over time. It is divided into three areas: a 24‑hour summary, a per‑suite trend chart, and a detailed statistics table.
Past 24 Hours
The top section summarizes activity from the last 24 hours and highlights where problems are concentrated.
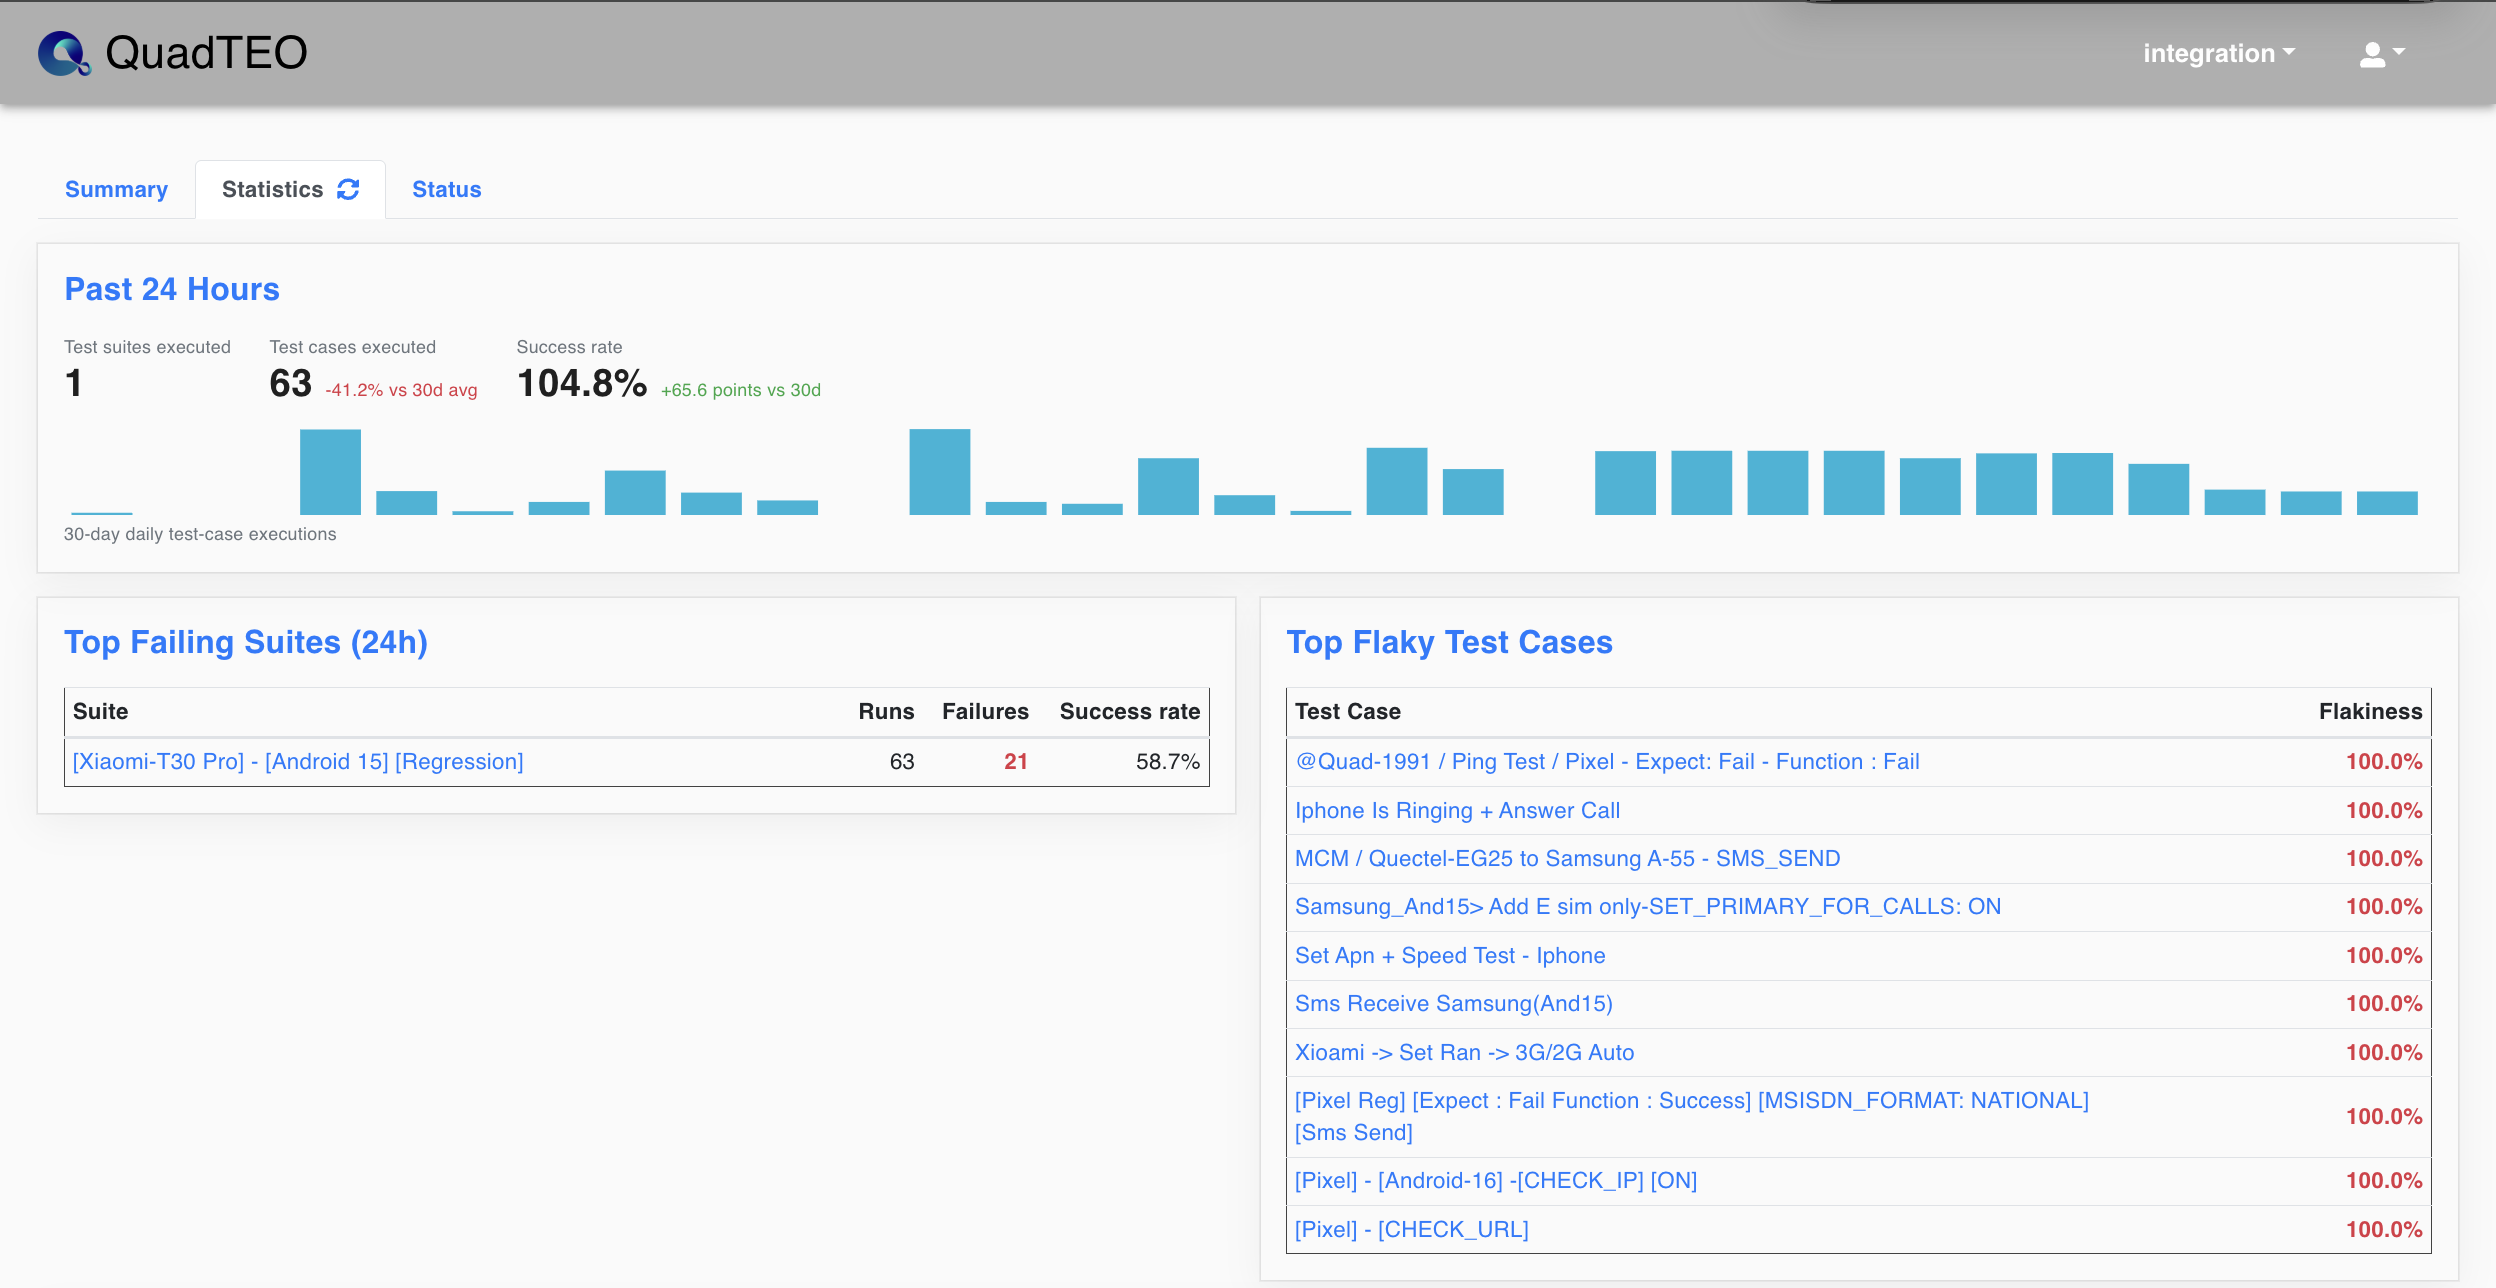
- Test suites executed: Number of Test Suites that ran in the last 24 hours.
- Test cases executed: Total number of Test Cases executed, with the change compared to the previous 30‑day average.
- Success rate: Overall success percentage for the period, with the change versus the prior period.
- 30‑day daily test‑case executions: A bar chart showing daily execution volume across the last 30 days.
- Top Failing Suites (24h): The suites with the most failures, listing Runs, Failures, and Success rate for each.
- Top Flaky Test Cases: Test Cases that produce inconsistent (flaky) results, ranked by their Flakiness percentage.
Per-Suite Trend
This chart breaks down the daily outcome of a single Test Suite so you can spot regressions or improvements over time.
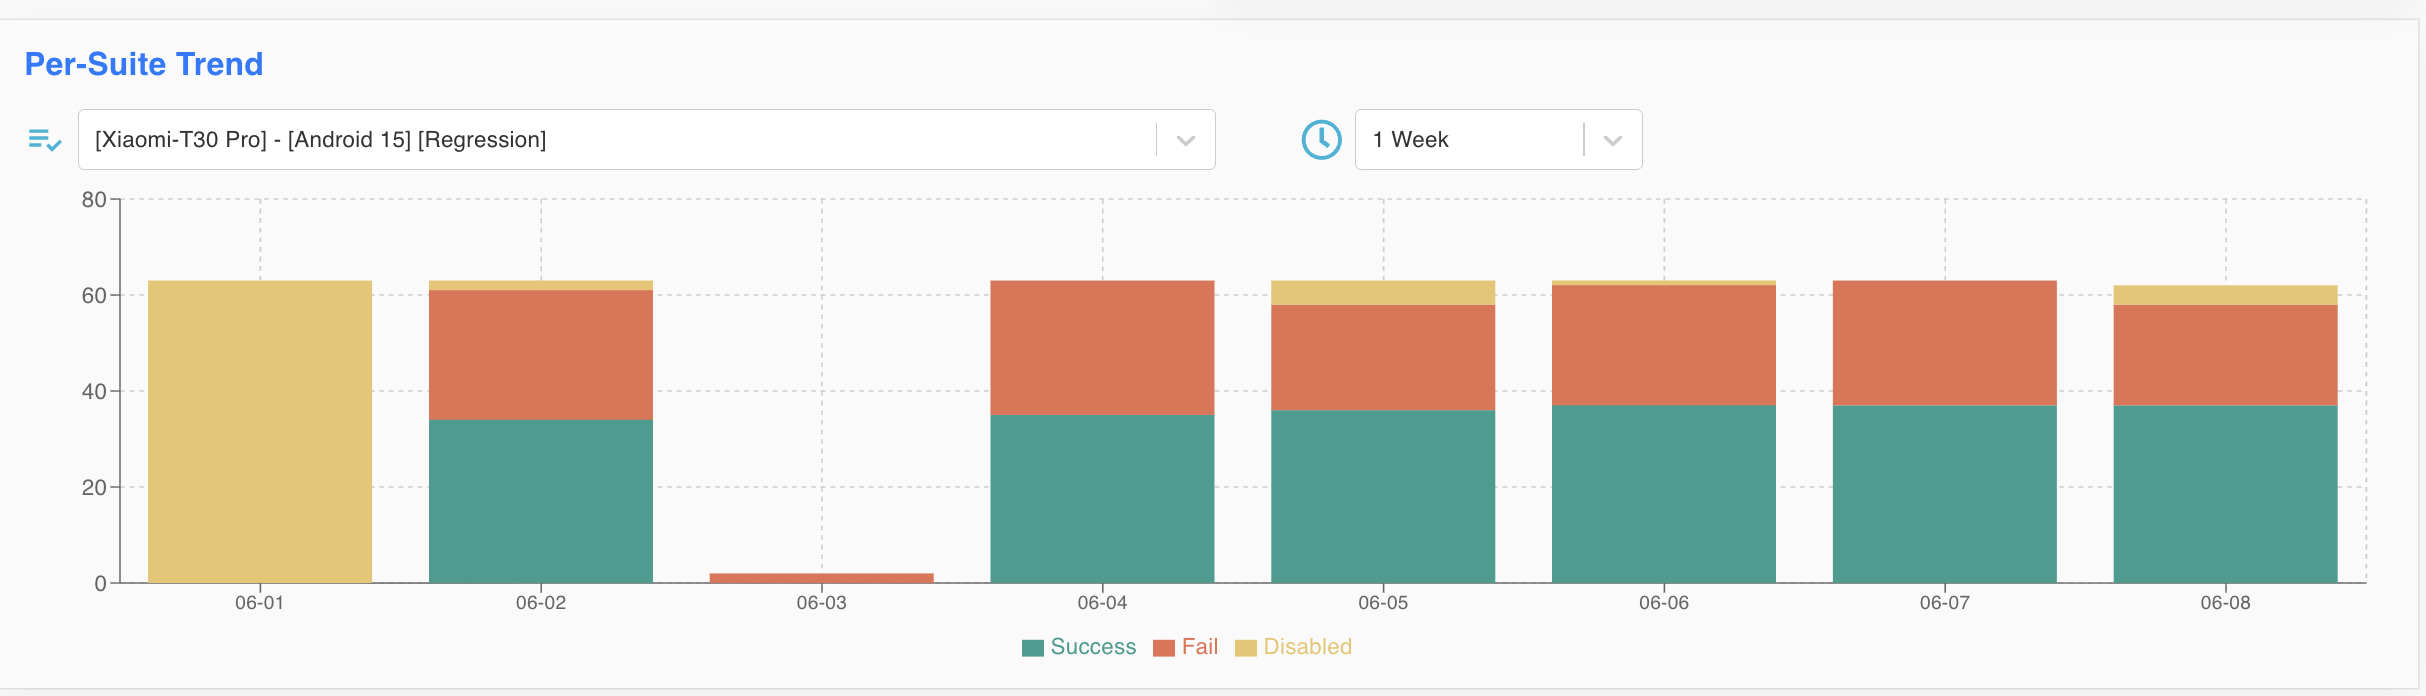
- Suite selector: Choose the Test Suite you want to analyze (e.g.
[Xiaomi-T30 Pro] - [Android 15] [Regression]). - Time range selector: Choose the period to display (e.g.
1 Week). - Stacked bars: Each day is represented by a stacked bar showing:
- Success (green): Test cases that passed.
- Fail (red): Test cases that failed.
- Disabled (yellow): Test cases that were disabled and not executed.
Test Suite Statistics Table
The table lists every Test Suite with its detailed execution statistics. Use the search box and pagination to find a specific suite.
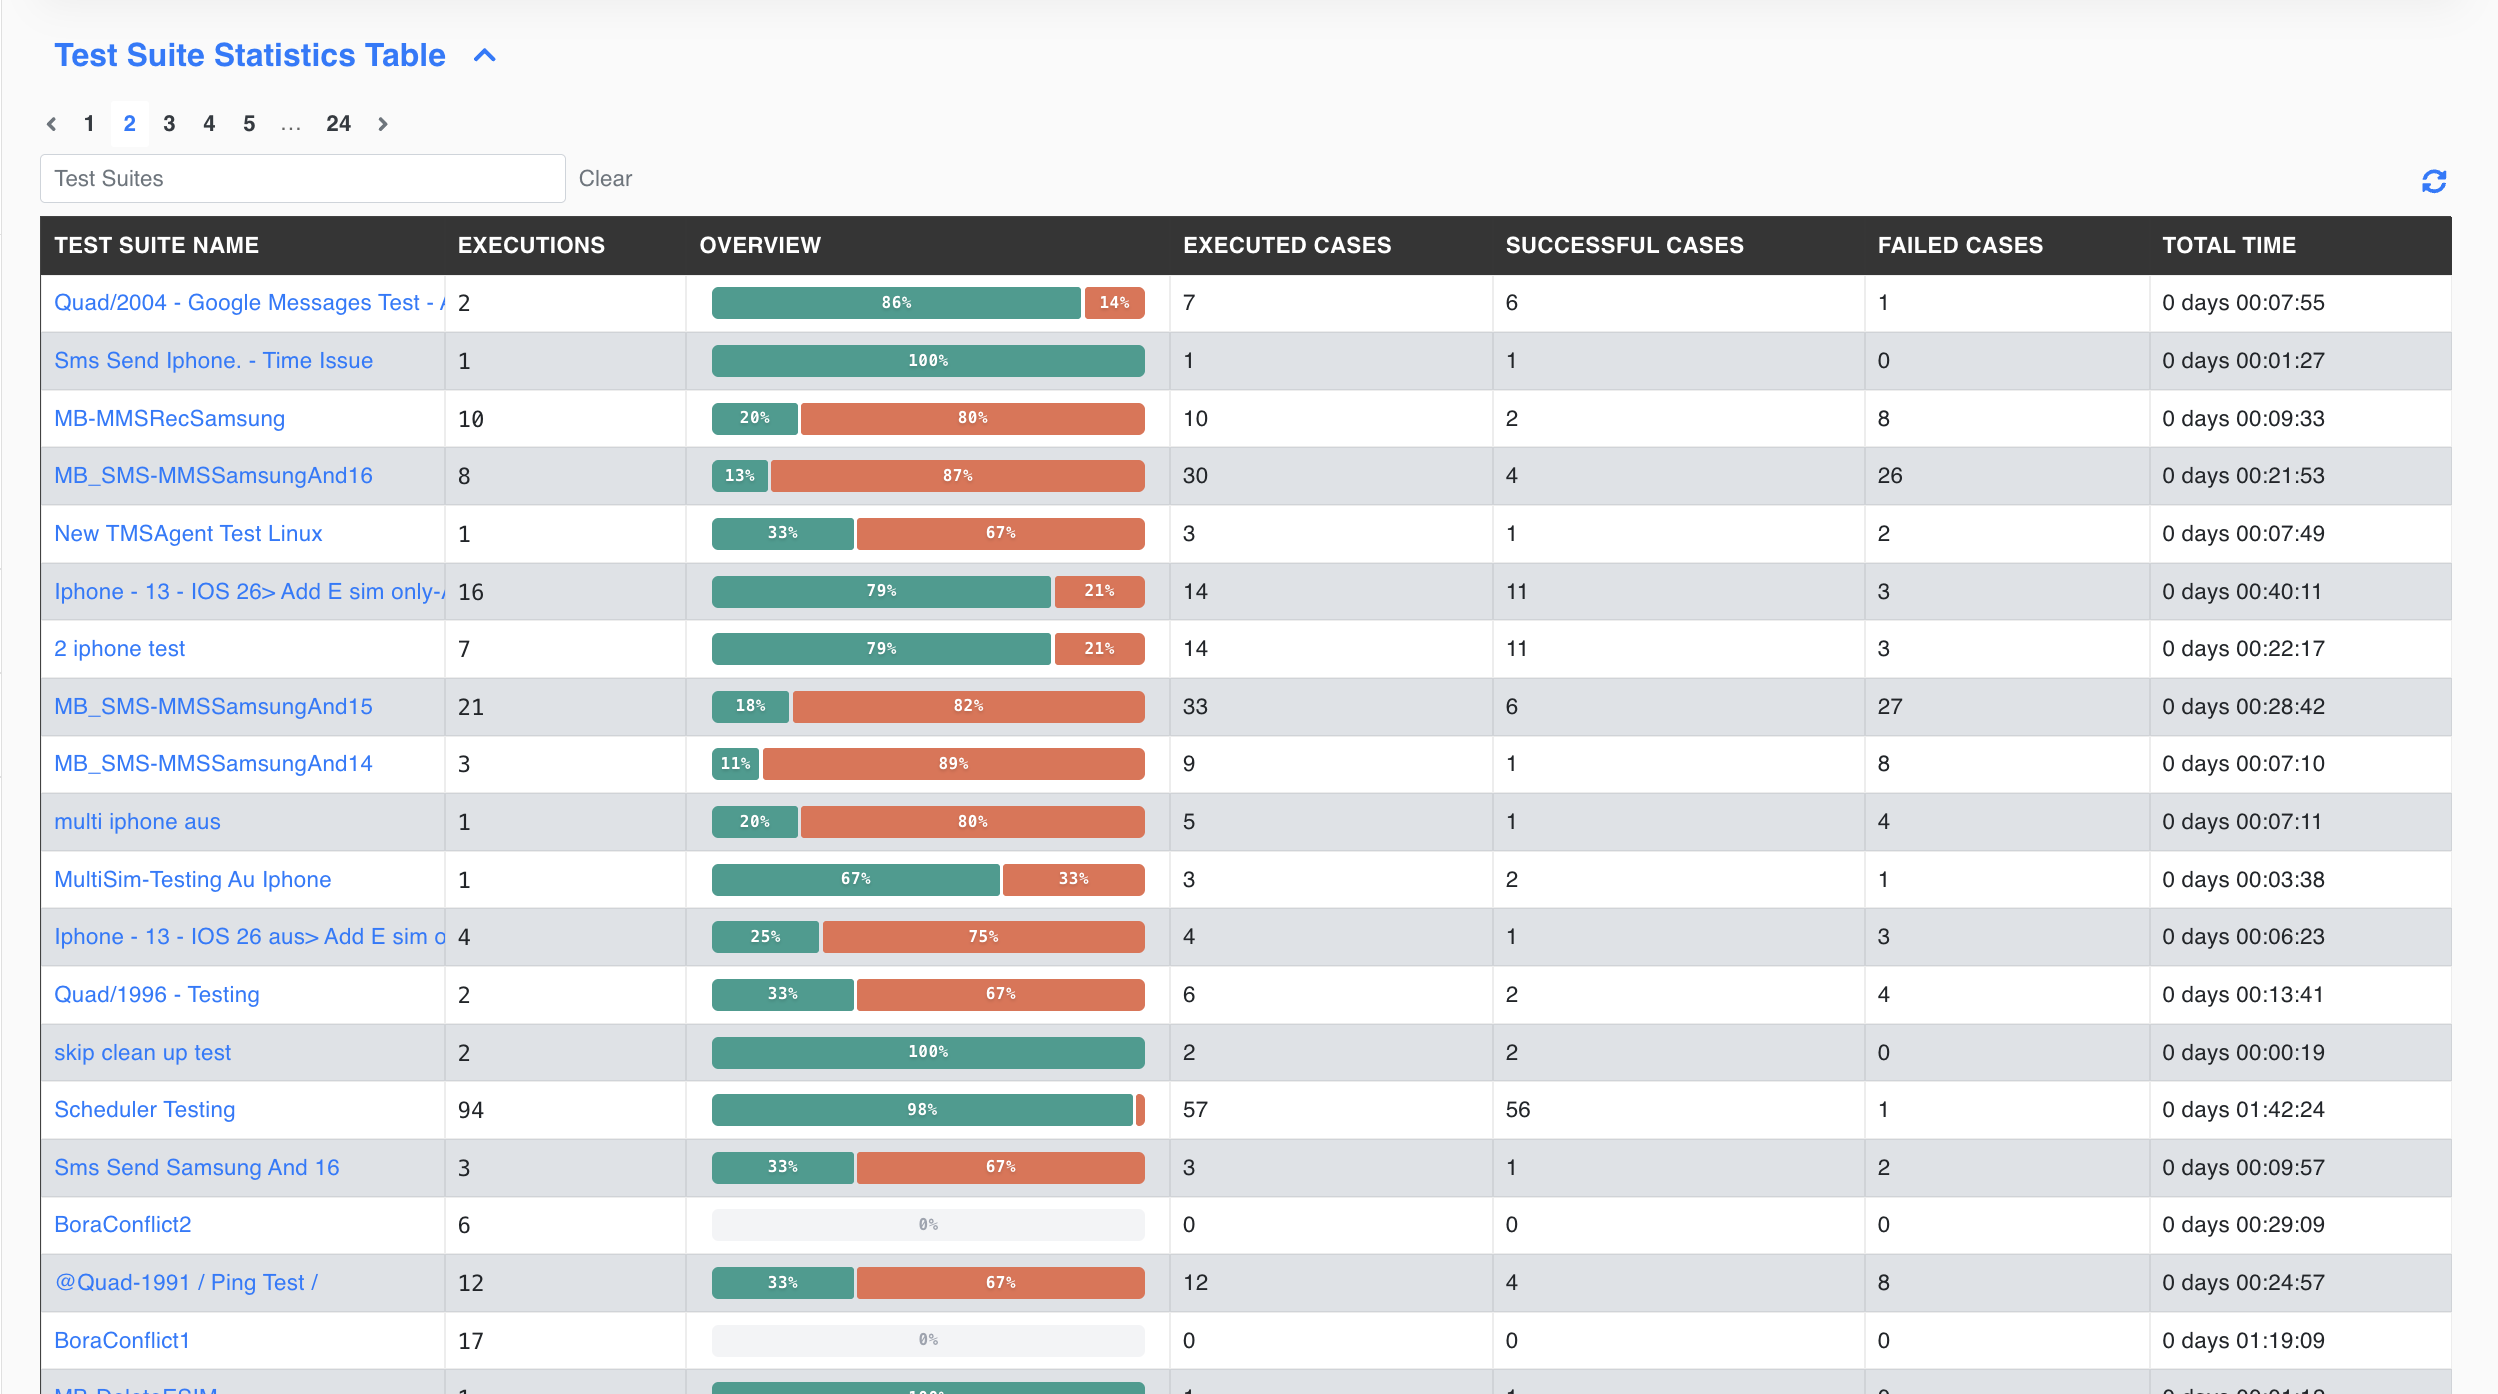
- Test Suite Name: The name of the suite (clickable for details).
- Executions: How many times the suite has been executed.
- Overview: A visual success/fail ratio bar for the suite.
- Executed Cases: Total number of Test Cases executed within the suite.
- Successful Cases: Number of Test Cases that passed.
- Failed Cases: Number of Test Cases that failed.
- Total Time: Cumulative execution time for the suite.