Overview
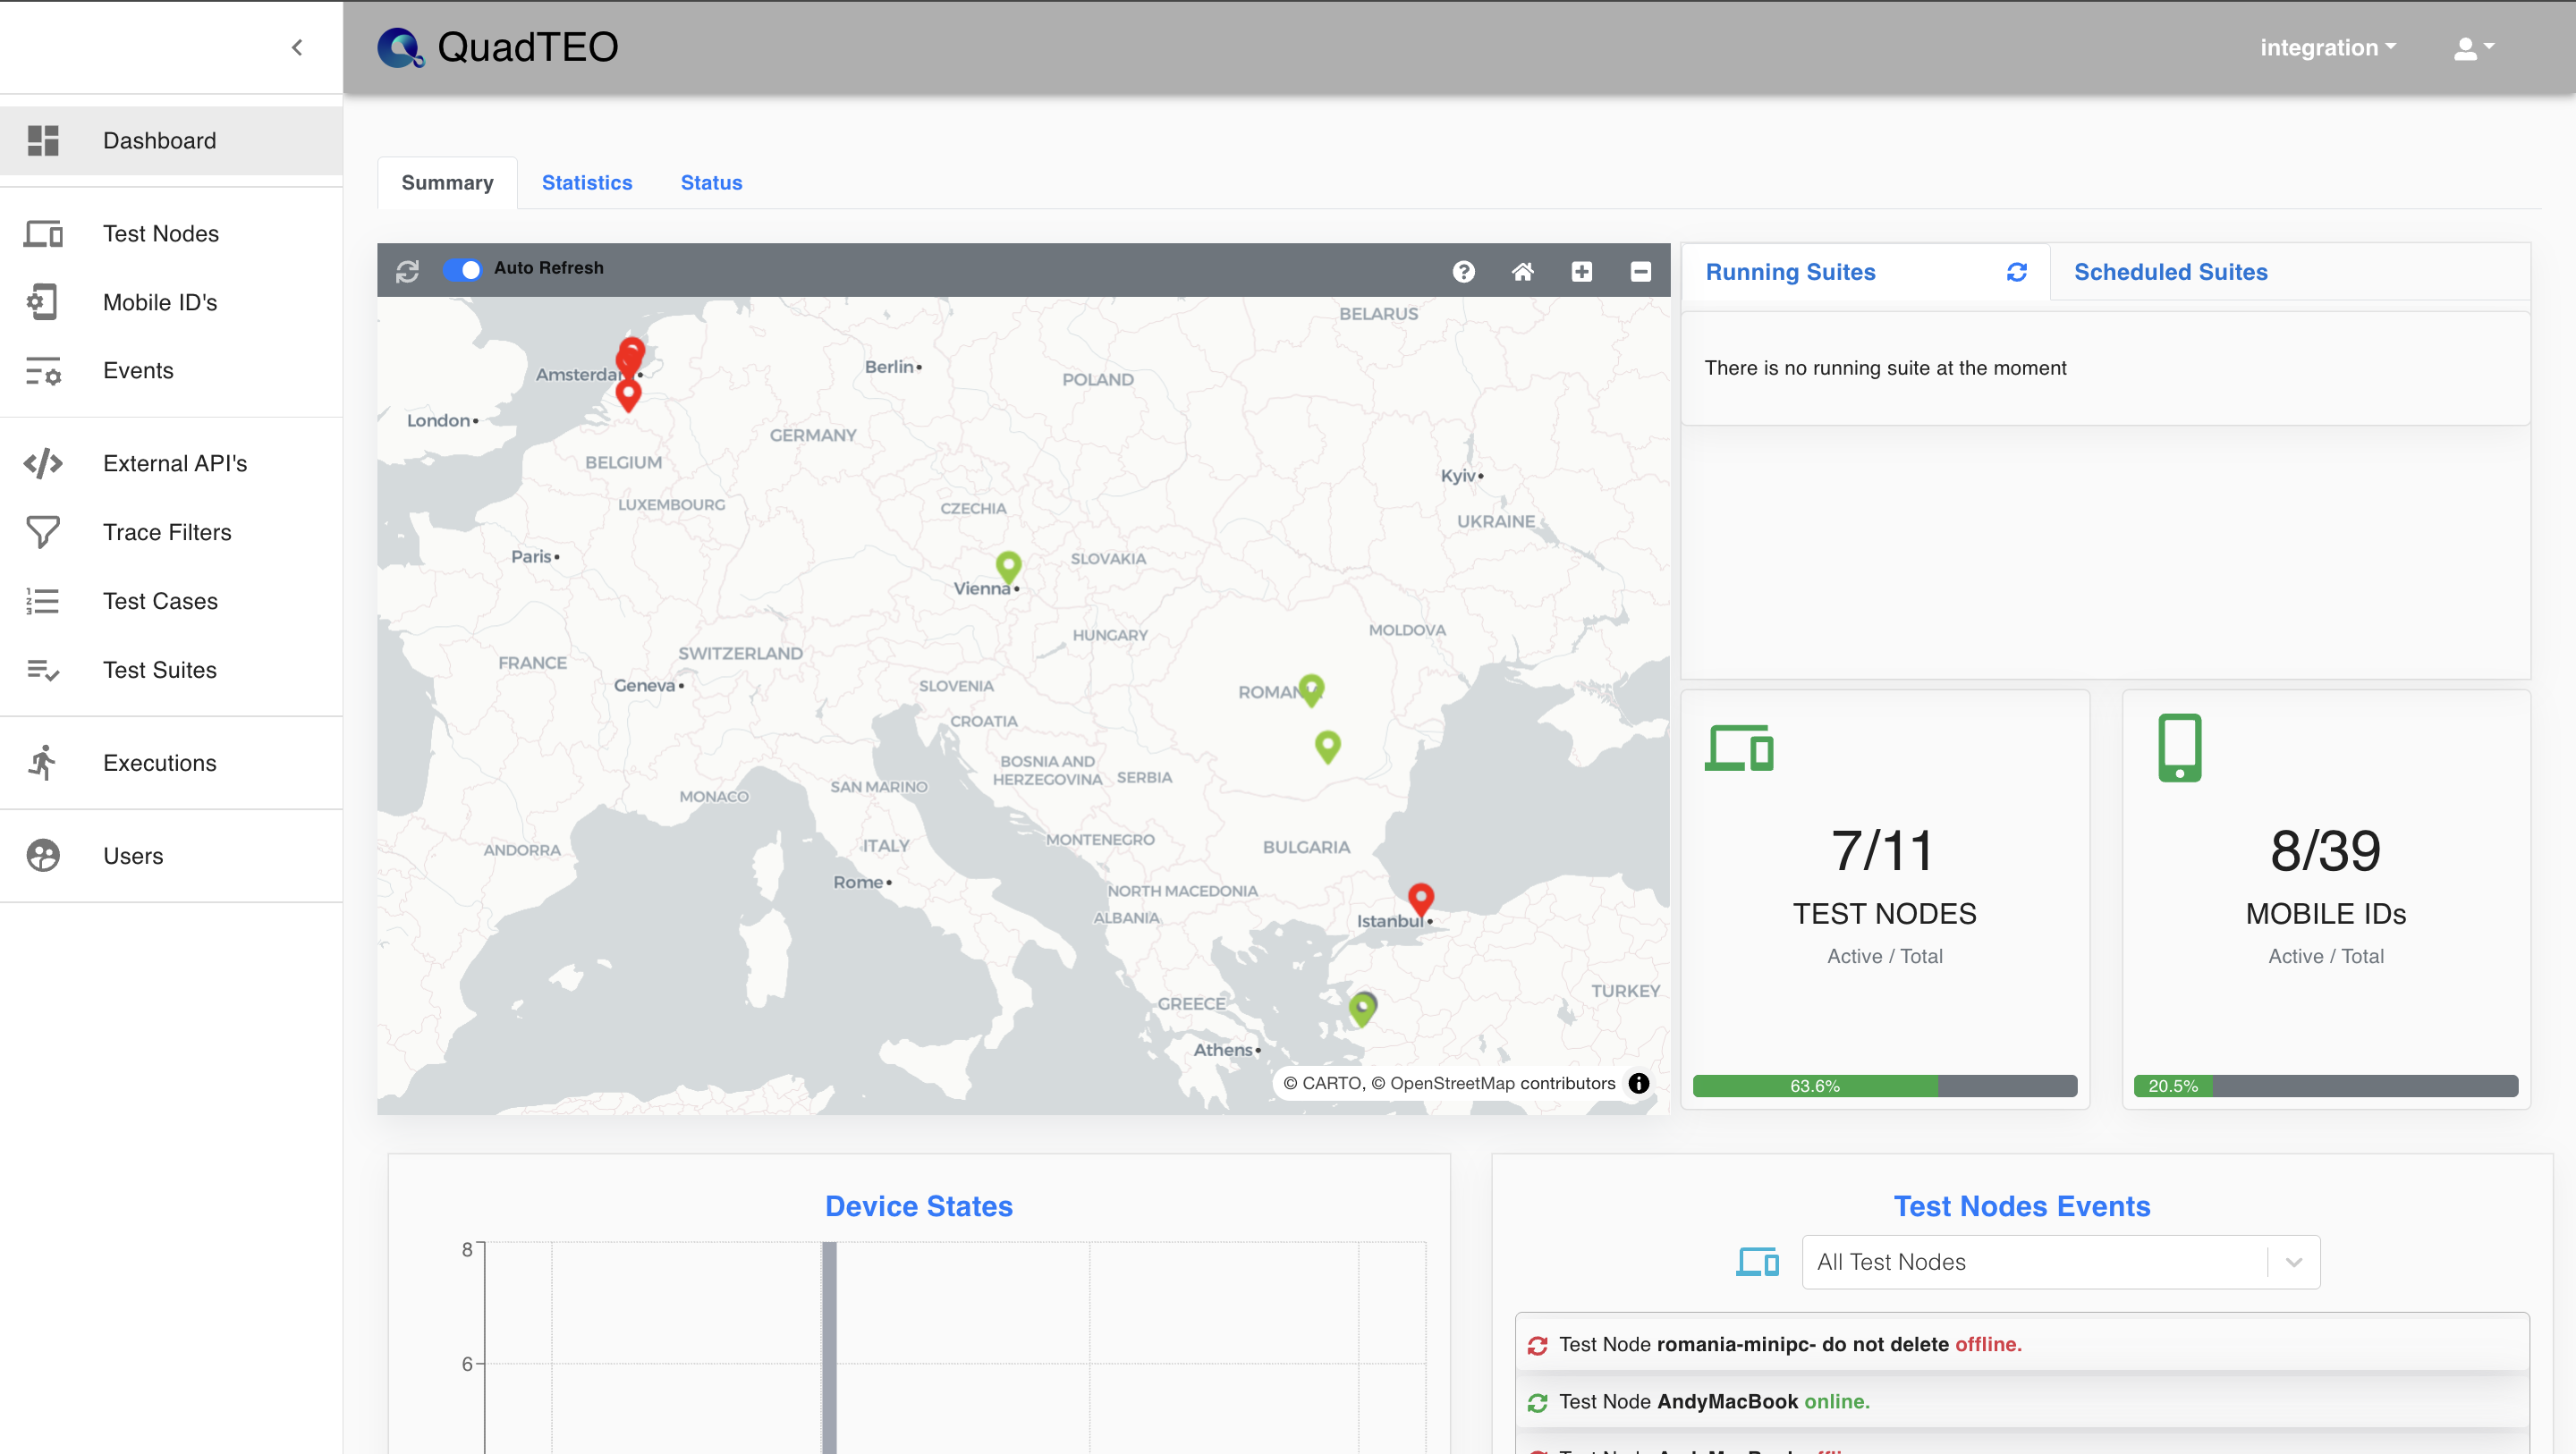
This page provides an overview of the test process status in the QuadTEO interface and contains the following sections:
Map : Displays the geographical locations and statuses of test nodes. Different colors represent the current state of the test nodes (e.g., red for failures, green for active nodes).
Running Suites : Shows any currently running test suites. In this example, there are no running suites at the moment.
Scheduled Suites : Lists the test suites that are scheduled to run. No suites are scheduled in the current view.
Active Test Node : Displays the total number of test nodes and mobile IDs along with the number of active ones.
Mobile ID Cards : In this case, 2 out of 9 test nodes are active, and 1 out of 25 mobile IDs is currently in use.
Test Nodes Devices : A bar chart showing the status of devices in test nodes. The chart uses different colors to indicate the device states (e.g., failed, busy, or available).
Test Nodes Events : AA list of events related to test nodes, including failure reports and recovery details for specific devices.