Creating a Dashboard in Grafana
Follow these steps to create a new dashboard in Grafana after logging into your account.
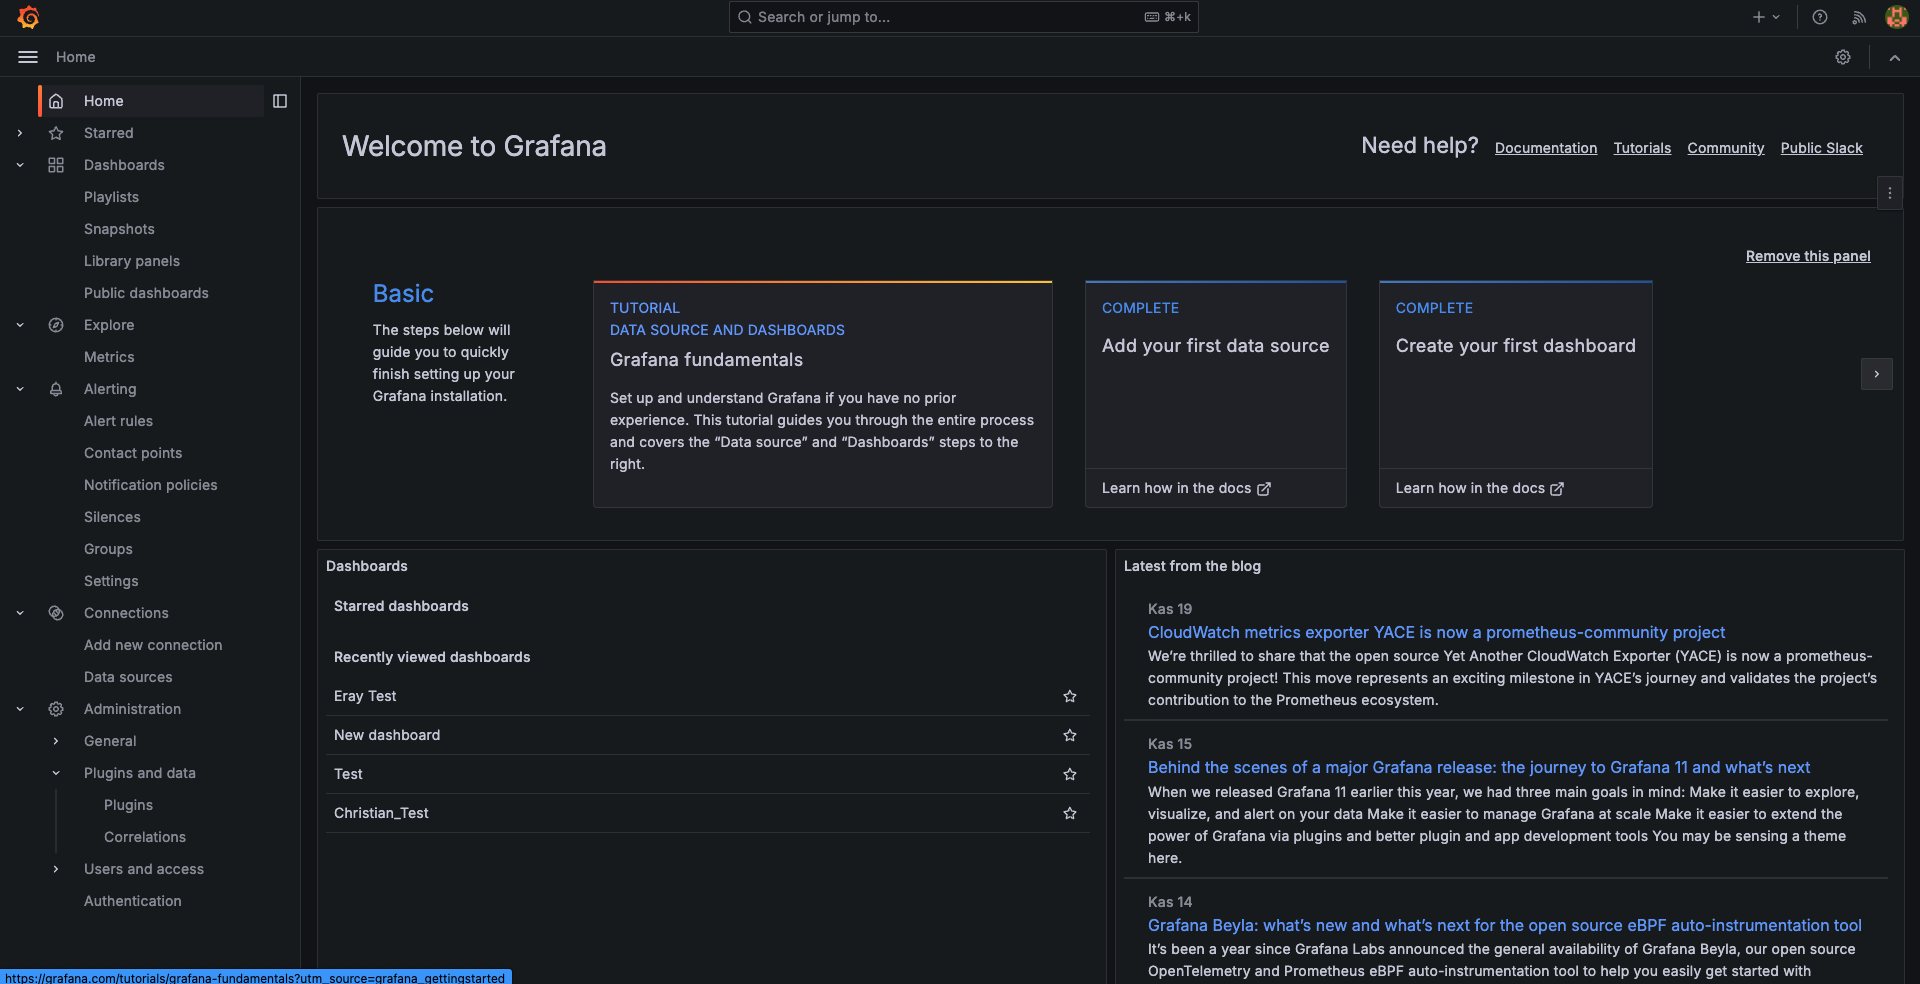
Step 1: Navigate to the Dashboard Section
After logging in, click on the Dashboard button from the menu on the left side of the Grafana homepage.
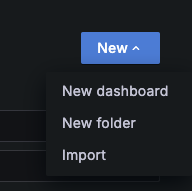
Step 2: Start a New Dashboard
On the Dashboard page, click the New button in the top-right corner.
From the dropdown menu, select New Dashboard.
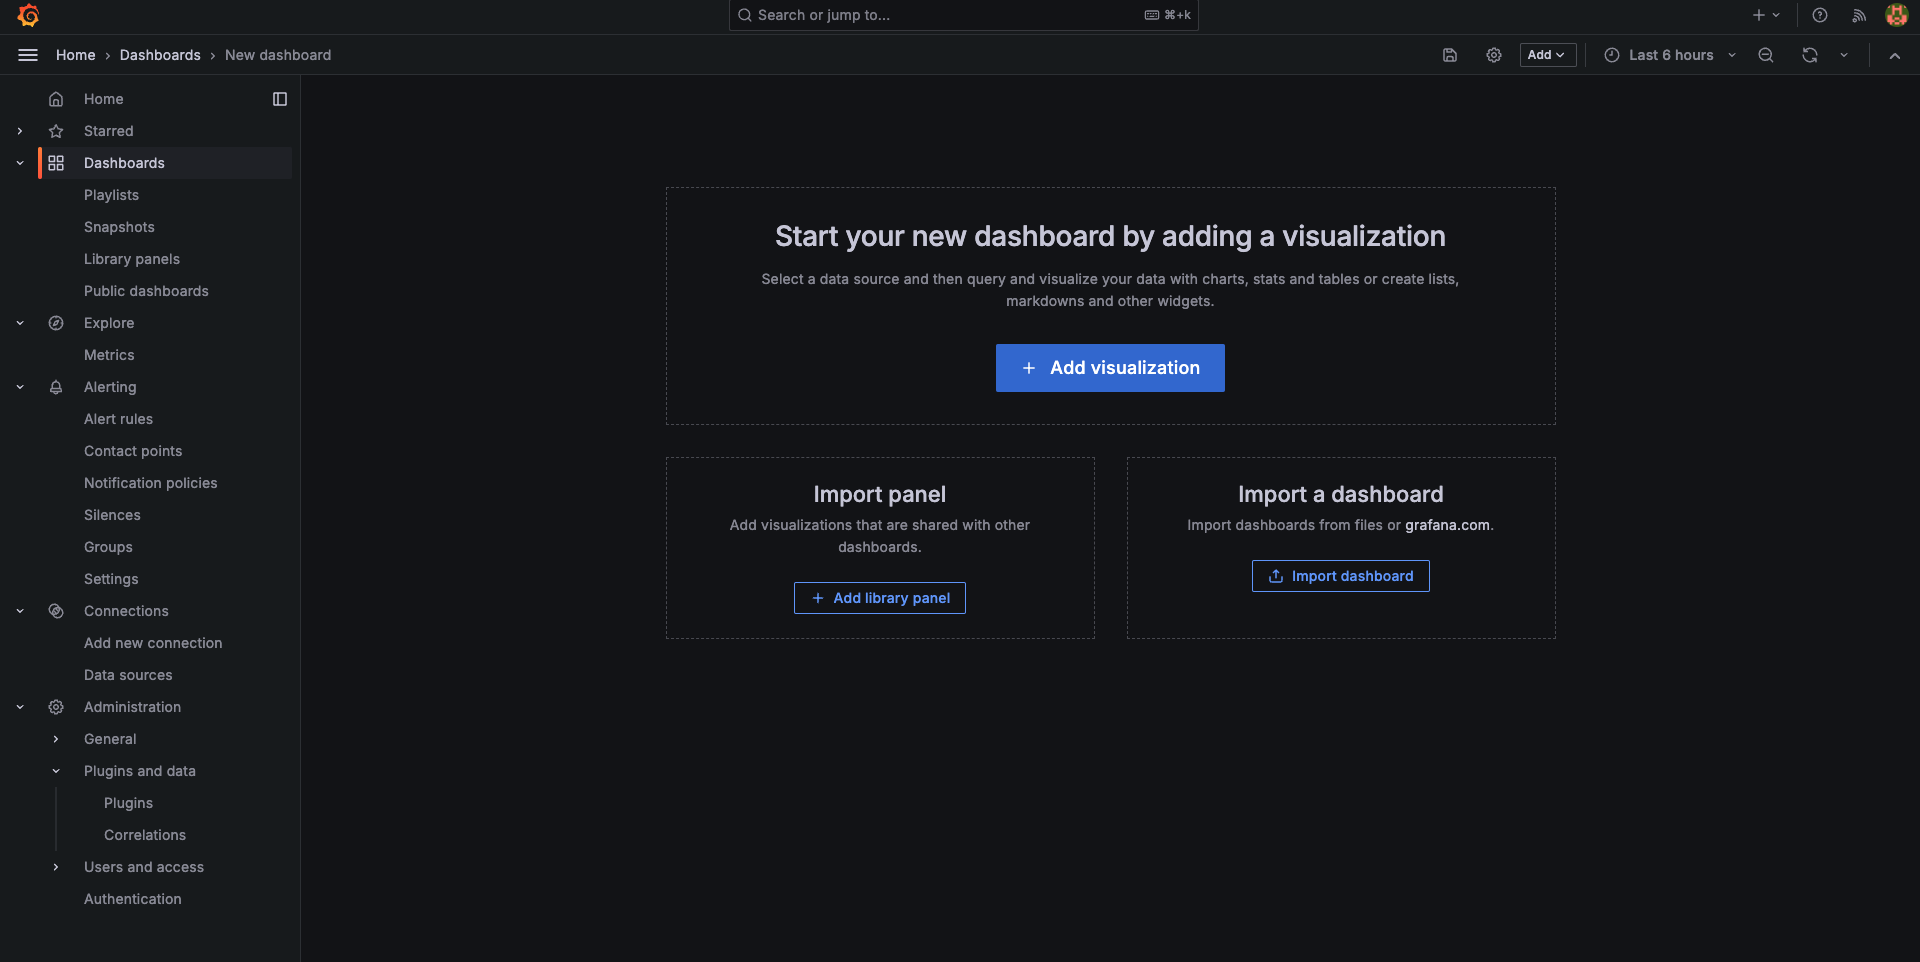
Step 3: Add a Visualization
Click the Add Visualization button to start creating your chart or graph.
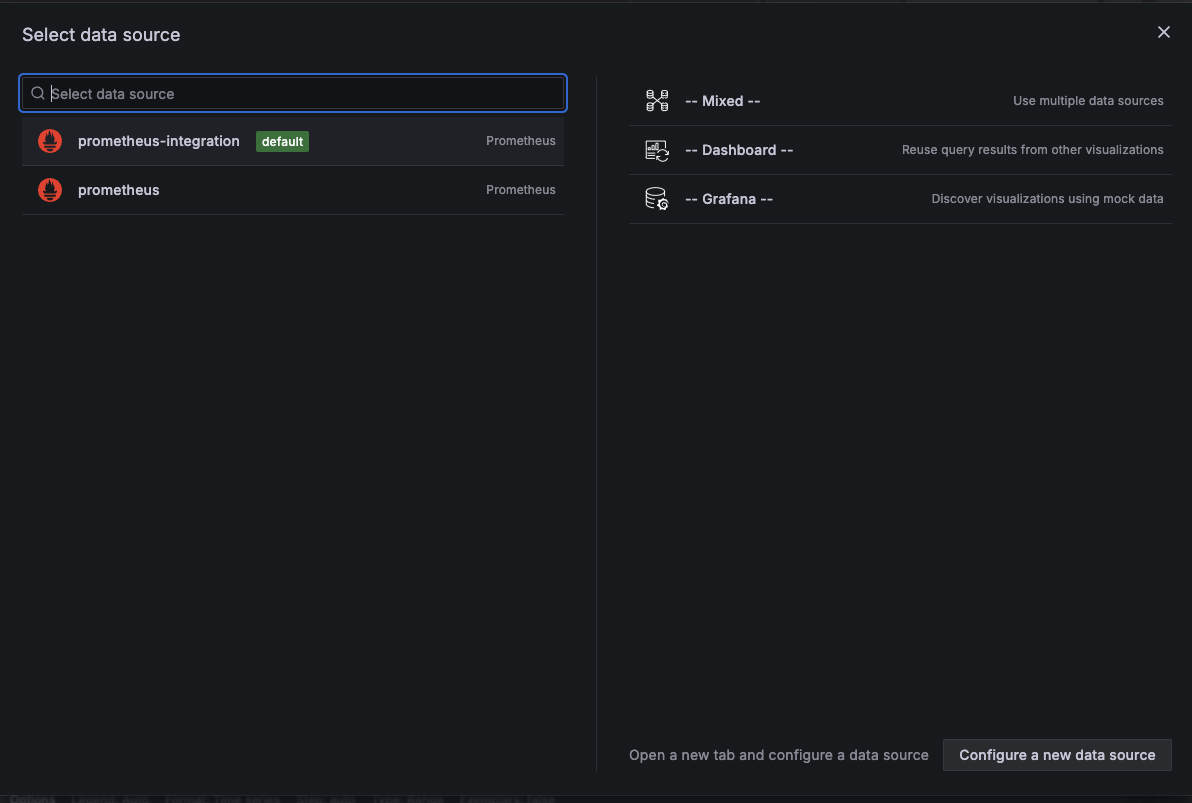
Step 4: Select a Data Source
Choose your desired Data Source from the available options.
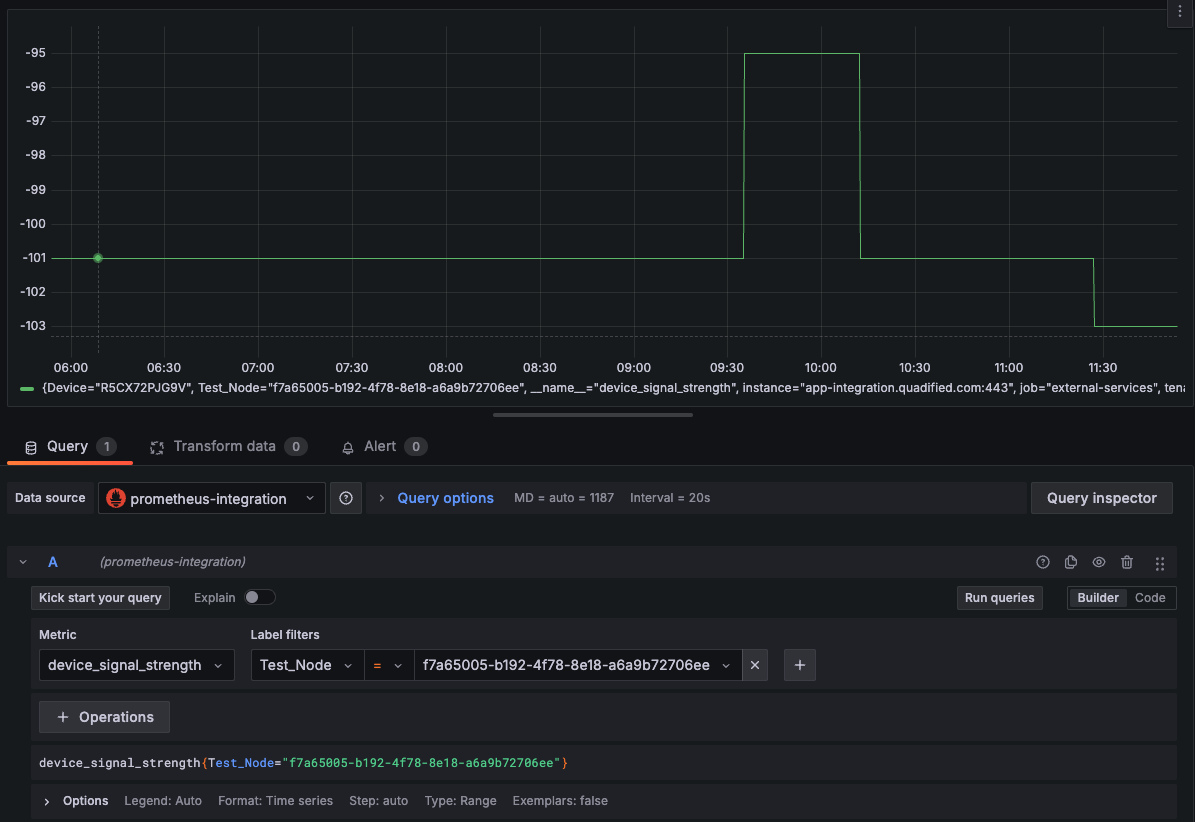
Step 5: Customize the Visualization
You are now ready to customize the visualization.
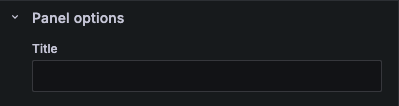
- Set a Title:
On the right-hand side, enter a title for your visualization in the title textbox.
Example: Test Case Results Total Monitoring.
- Select a Metric:
Choose a metric to display the desired data.

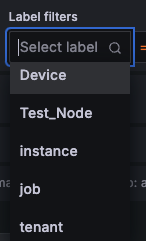
- Filter by Label:
Use the label filter to narrow down the data, e.g., Test Node.
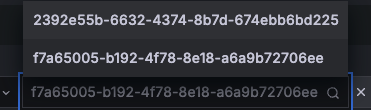
- Select Test Node ID:
If filtering by Test Node, you can also select the ID of the chosen test node.
Step 6: Save the Visualization
Click the Save button in the top-right corner to save your visualization.

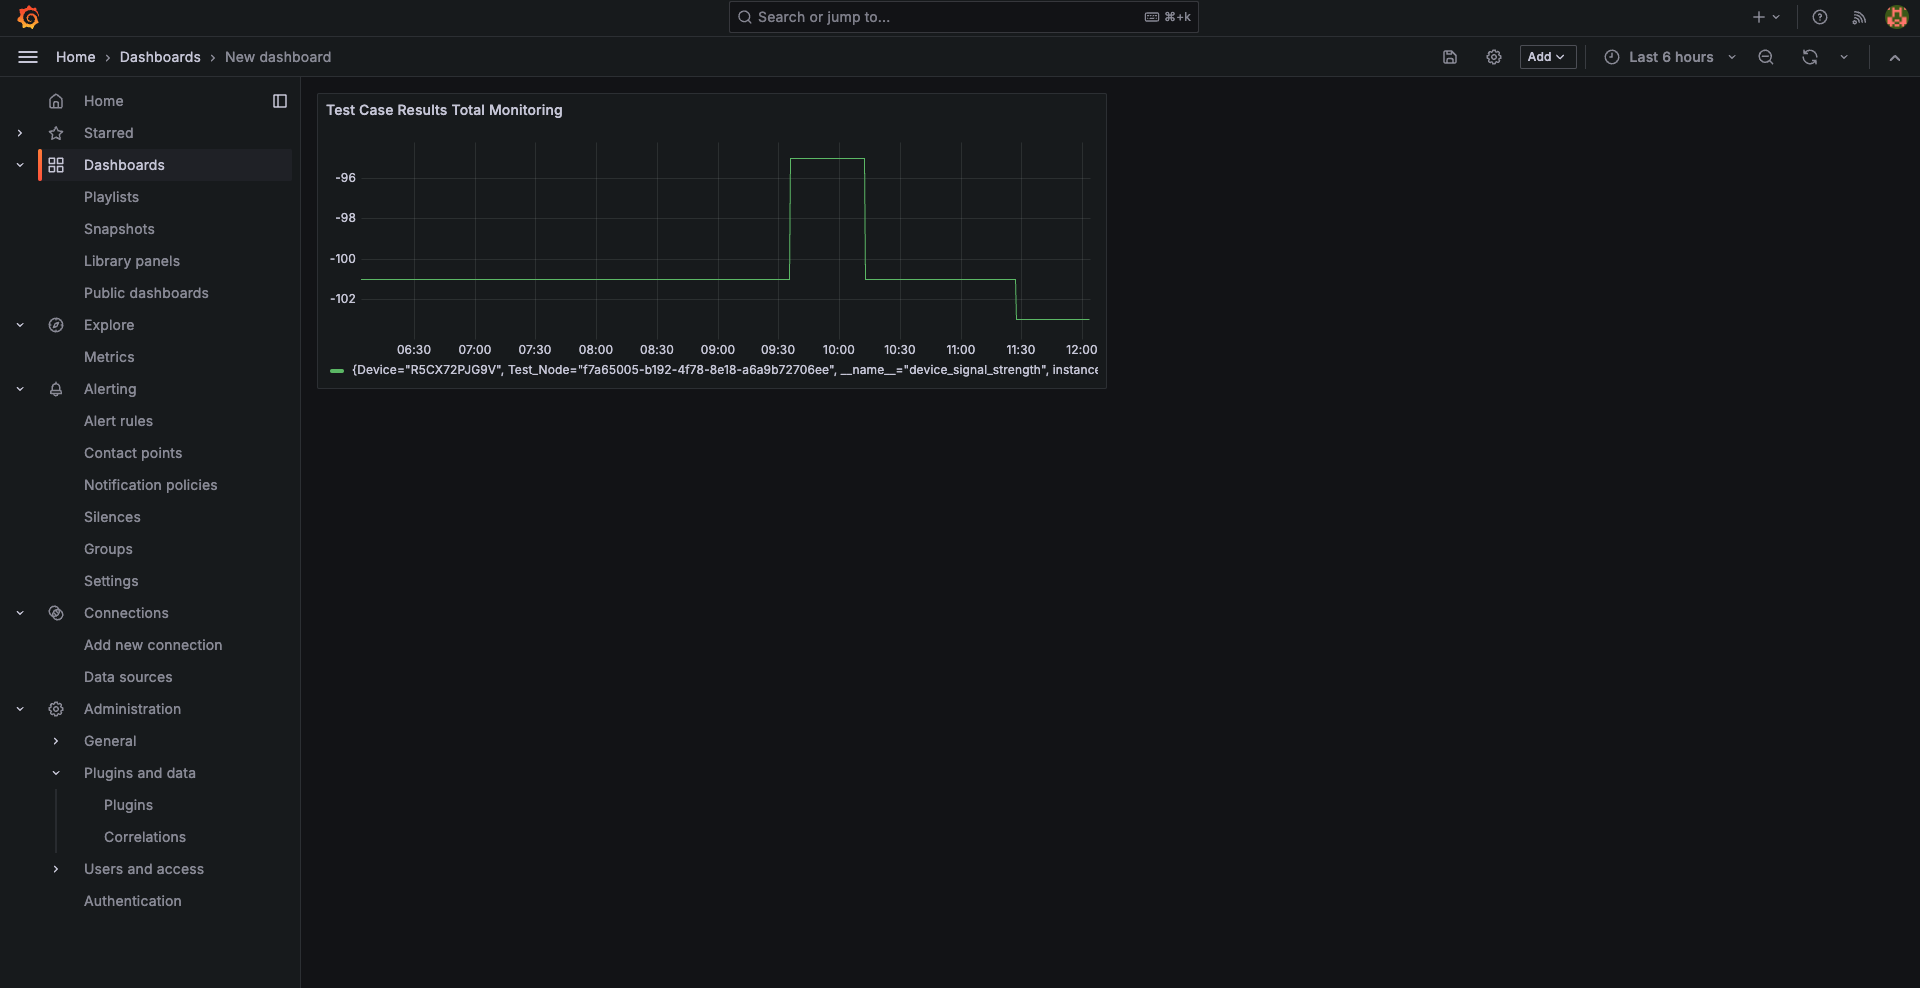
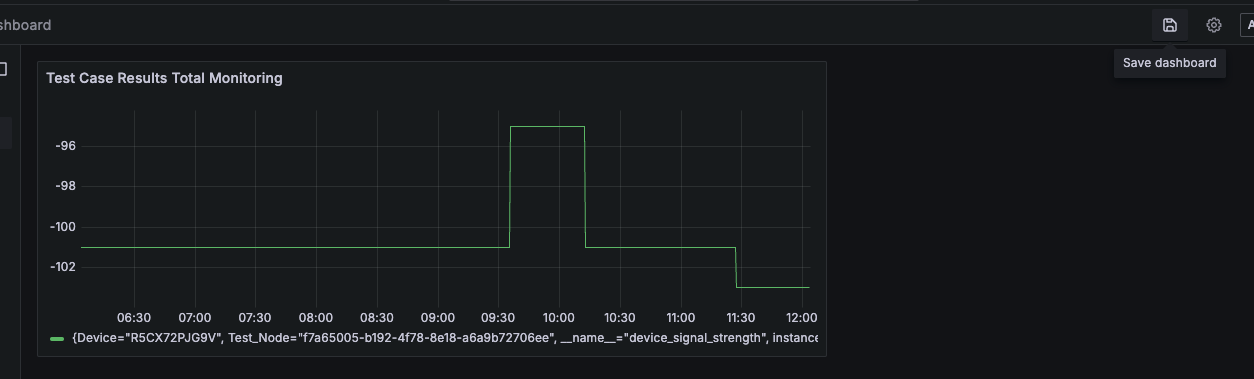
Step 7: View the Generated Chart
Once configured and saved, your chart will appear in the central workspace.
Step 8: Save the Dashboard
Finally, click the save icon to save the entire dashboard.
Result
Your dashboard is now successfully created and saved. You can view it anytime from the Dashboard section.